Piechartmaker

Piechartmaker - Create Simple Pie Charts, Doughnut Charts & Bar Graphs with Chart Tools

Piechartmaker

Piechartmaker -介紹

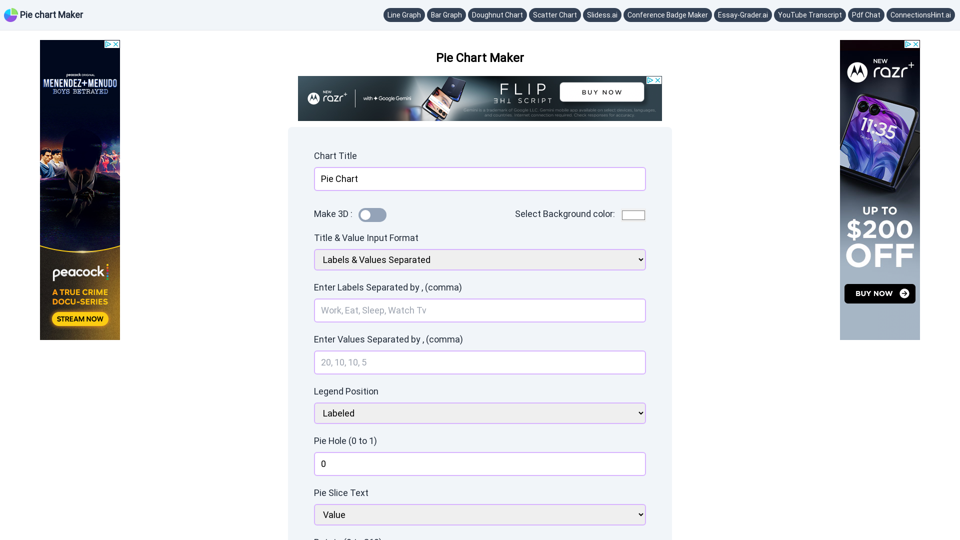
Piechartmaker is an intuitive online tool designed to simplify the creation of visually appealing pie charts. Whether you're a student, educator, or professional, this platform offers a user-friendly interface that allows you to transform raw data into clear, concise visual representations. With Piechartmaker, you can easily input your data and customize your chart to suit your needs, making it an ideal choice for presentations, reports, or educational purposes. The tool is perfect for those who want to avoid the complexities of traditional chart-making software, offering a straightforward solution for creating pie charts that effectively communicate your data insights.

Piechartmaker -功能

Product Features of Piechartmaker

Overview

Piechartmaker is an intuitive online tool designed to create visually appealing pie charts, doughnut charts, and bar graphs with ease. It simplifies the process of data visualization, allowing users to generate charts quickly without the need for complex software.

Main Purpose and Target User Group

The primary purpose of Piechartmaker is to provide users with an easy-to-use platform for creating simple pie charts and other chart types. It is ideal for students, educators, business professionals, and anyone who needs to present data in a clear and visually engaging manner.

Function Details and Operations

  • Chart Creation: Users can create pie charts, doughnut charts, and bar graphs by simply entering data and selecting their preferred chart type.

  • Customization Options: Customize charts by changing background colors, legend positions, and title colors. Users can also create 3D pie charts and adjust the pie hole size in doughnut charts.

  • Data Input: Input data using labels and values separated by commas, with options for different input formats.

  • Download Options: Download charts in multiple formats, including PNG, JPEG, and SVG.

User Benefits

  • Ease of Use: No need for complex software; create charts with just a few clicks.

  • Customization: Tailor charts to fit specific presentation needs with various customization options.

  • Versatility: Suitable for a wide range of users, from students to professionals, for diverse applications.

Compatibility and Integration

Piechartmaker is a web-based tool accessible from any device with internet connectivity, ensuring compatibility across various operating systems and browsers.

Customer Feedback and Case Studies

Users have praised Piechartmaker for its simplicity and efficiency in creating professional-looking charts. Case studies highlight its use in educational settings for student projects and in business environments for data presentations.

Access and Activation Method

Access Piechartmaker by visiting the website at https://piechartmaker.co. No software installation is required, and users can start creating charts immediately upon visiting the site.

Piechartmaker -常見問題

Frequently Asked Questions

What is Piechartmaker?

Piechartmaker is an online tool that allows users to create visually appealing pie charts, doughnut charts, and bar graphs with ease. It simplifies the process of chart creation by providing user-friendly options to customize and download charts in various formats.

How do I create a pie chart using Piechartmaker?

To create a pie chart, simply enter your data by separating labels and values with commas. You can customize the chart by selecting background colors, legend positions, and text options. Once you're satisfied with your settings, click on "Generate Graph" to create your pie chart.

Can I make a 3D pie chart with Piechartmaker?

Yes, you can easily create a 3D pie chart with Piechartmaker. Just select the "Make 3D" option while setting up your chart.

What file formats can I download my charts in?

You can download your charts in .jpg, .png, or .svg formats, making it easy to use them in presentations, reports, or on websites.

What is the difference between a pie chart and a doughnut chart?

A pie chart is a circular graph divided into slices to illustrate numerical proportions. A doughnut chart is similar but has a hole in the center, giving it a doughnut-like appearance.

Can I customize the colors of the chart elements?

Yes, Piechartmaker allows you to customize the colors of the chart's title, legend, and background to suit your preferences.

Is Piechartmaker suitable for large data sets?

Pie charts are generally more suitable for small data sets. For larger data sets, you might consider using bar graphs or other types of charts available on Piechartmaker.

Can I rotate the pie chart?

Yes, you can rotate the pie chart by adjusting the rotation angle from 0 to 360 degrees to achieve your desired orientation.

Is Piechartmaker free to use?

Yes, Piechartmaker is free to use, making it an accessible tool for students and professionals alike.

What other types of charts can I create with Piechartmaker?

In addition to pie and doughnut charts, you can also create line graphs, bar graphs, and scatter charts using Piechartmaker.

Piechartmaker -數據分析

最新流量資訊

  • 每月訪問量

    61.938K

  • 跳出率

    50.93%

  • 每次訪問頁數

    1.49

  • 訪問持續時間

    00:00:26

  • 全球排名

    662952

  • 國內排名

    485191

隨時間訪問量

流量來源

  • 直接:
    23.10%
  • 引薦:
    4.46%
  • 社交:
    2.05%
  • 郵件:
    0.10%
  • 搜索:
    69.88%
  • 付費引薦:
    0.34%
更多數據

Piechartmaker - 替代

Line Graph Maker

Line Graph Maker - Create Custom Line Charts for Free | Data Visualization Tool

47.8 K
Spotify Bedroom

Spotify Bedroom - Transform Your Space with Music-Inspired Decor and Online Playlists

25.7 K
EzyGraph

EzyGraph - AI-Powered Infographics for Enhanced Content Engagement | User-Friendly Graphing Tool

10.1 K
Bharat Diffusion AI

Bharat Diffusion AI - Create Traditional Indian AI Images and Visuals Culture

2.4 K
更多標籤關於: Piechartmaker